Observability in the cloud is revolutionizing how businesses monitor and maintain their infrastructure. One of our customers from the automobile industry was facing frequent performance issues with their application, causing dissatisfaction among their clients.As a MSP provider, when we took over the project, our priority was to set up robust observability tools. This allowed the platform's operations team to gain real-time insights into system performance, track detailed metrics, and correlate logs and traces to pinpoint the root cause of the issues without substantial cost overruns.
Typical Requirement
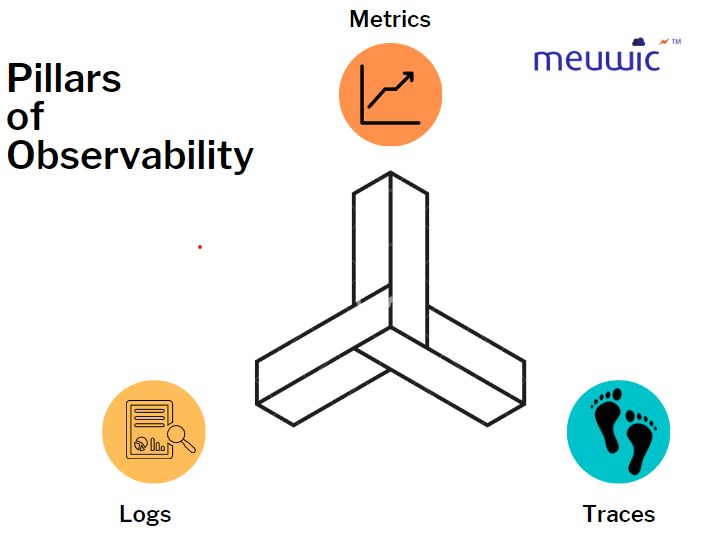
Top-Level Terminologies
Traces:
Request Tracing to the application
Auto Instrumentation (Avoid Application code changes - at best)
Logs:
All logs need to be pushed to a central location for viewing/filtering (Application logs, Proxy logs, Server logs, etc.)
Metrics:
Collect all metrics and KPIs required for the application (Infrastructure, Application, Azure Native Services, Custom metrics, etc.)
Alerts/Incidents:
Create alerts for metrics and logs.
Integrate Alerts with Notification channels like Teams channel, Email, PagerDuty, etc.
Define the Severity like Critical, High, Warn, Low
Centralized Dashboards:
Centralized dashboard for monitoring all the above mentioned Observability components.
The Monitoring Layers
> Application Layer
A typical scenario --
Request Tracing:
Traces:
The trace represents the entire execution path of the request which helps in anomaly detection, fault analysis, latency, and diagnostic purposes in distributed software systems.
Spans:
A Span represents a unit of work. They can be thought of as the work being done during an operation’s execution.
>>OpenTelemetry -- The Savior:
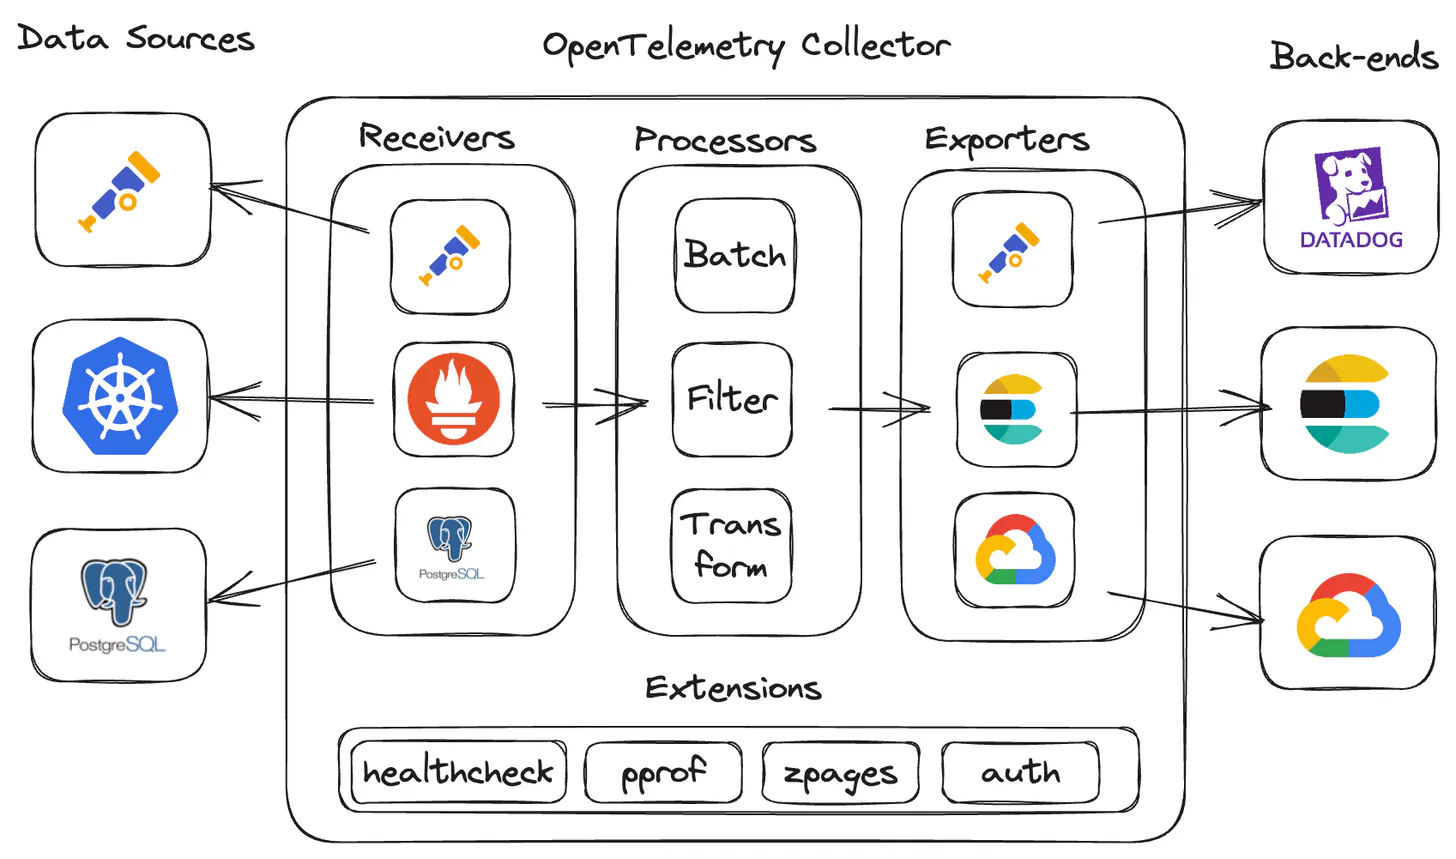
The OpenTelemetry project is an opensource framework that standardizes the way observability data (metrics, logs, and traces) are gathered, processed, and exported. It provides a vendor-agnostic pathway to nearly any back-end for insight and analysis.
Below is just for illustration purpose with respect to OpenTel
=> Primary components of the OpenTelemetry collector
Receivers: ingest data into the collector
Processor: enrich, reduce, and refine the data
Exporters: export the data to another collector or back-end
Connectors: connect two or more pipelines together
Extensions: expand collector functionality, in areas not directly related to data collection, processing, or transmission.
Together, these components can be linked together to create a logical, human-readable observability data pipeline within the collector’s configuration.
---
=> Types of Implementation
Microservices: OpenTelemetry Operator for Kubernetes
The below representation assumes that the application and OpenTelemetry tool runs on the Standalone Server as a monolithic application
----
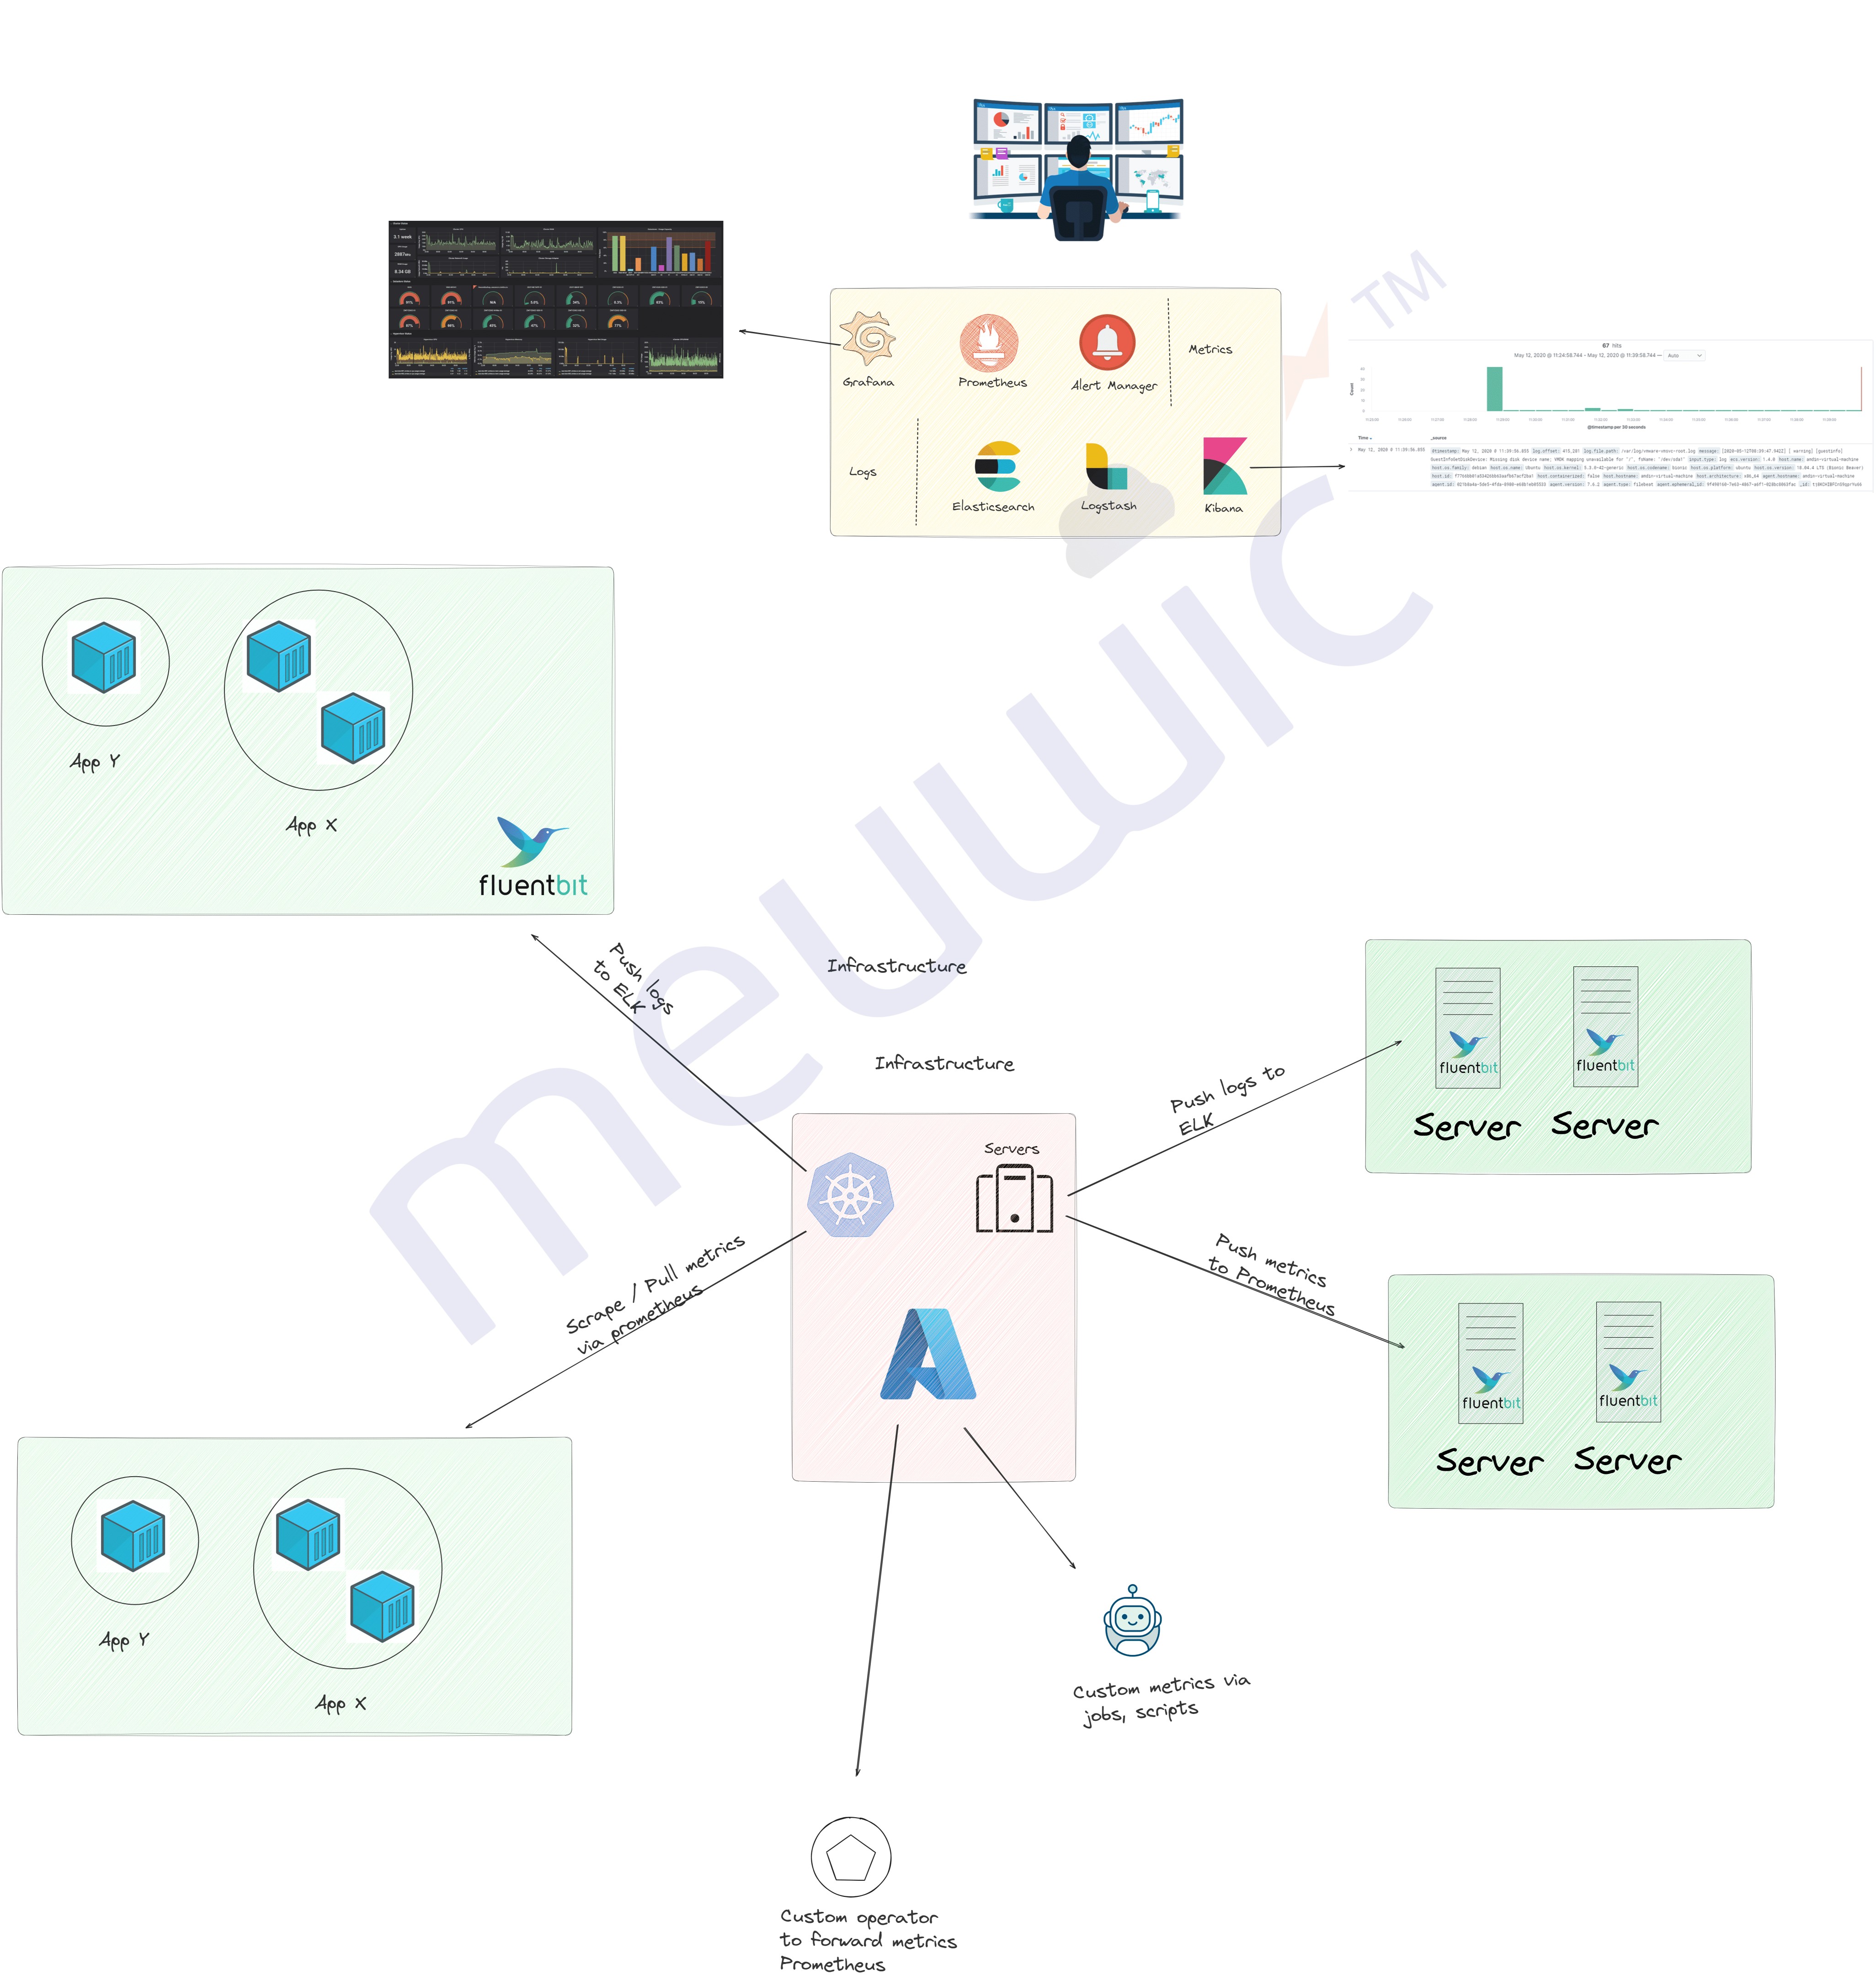
> Infrastructure Layer
The approach & configuration for Log and Metrics overlaps among Application and Infrastructure Layers. The log/metrics collection strategy is implemented using agents like FluentBit or Logstash, which collect and export logs to a centralized logging solution.
>> Logs / Metrics
Microservices:
We tend to deploy say, a fluentbit or other agent as daemonset to collect all the stdout which are emitted from the containers.
Then the logs will be pushed to say Elasticsearch and we can query/filter the logs.
We keep the logs for certain duration & then push it to archive or purge them, depends on use-case.
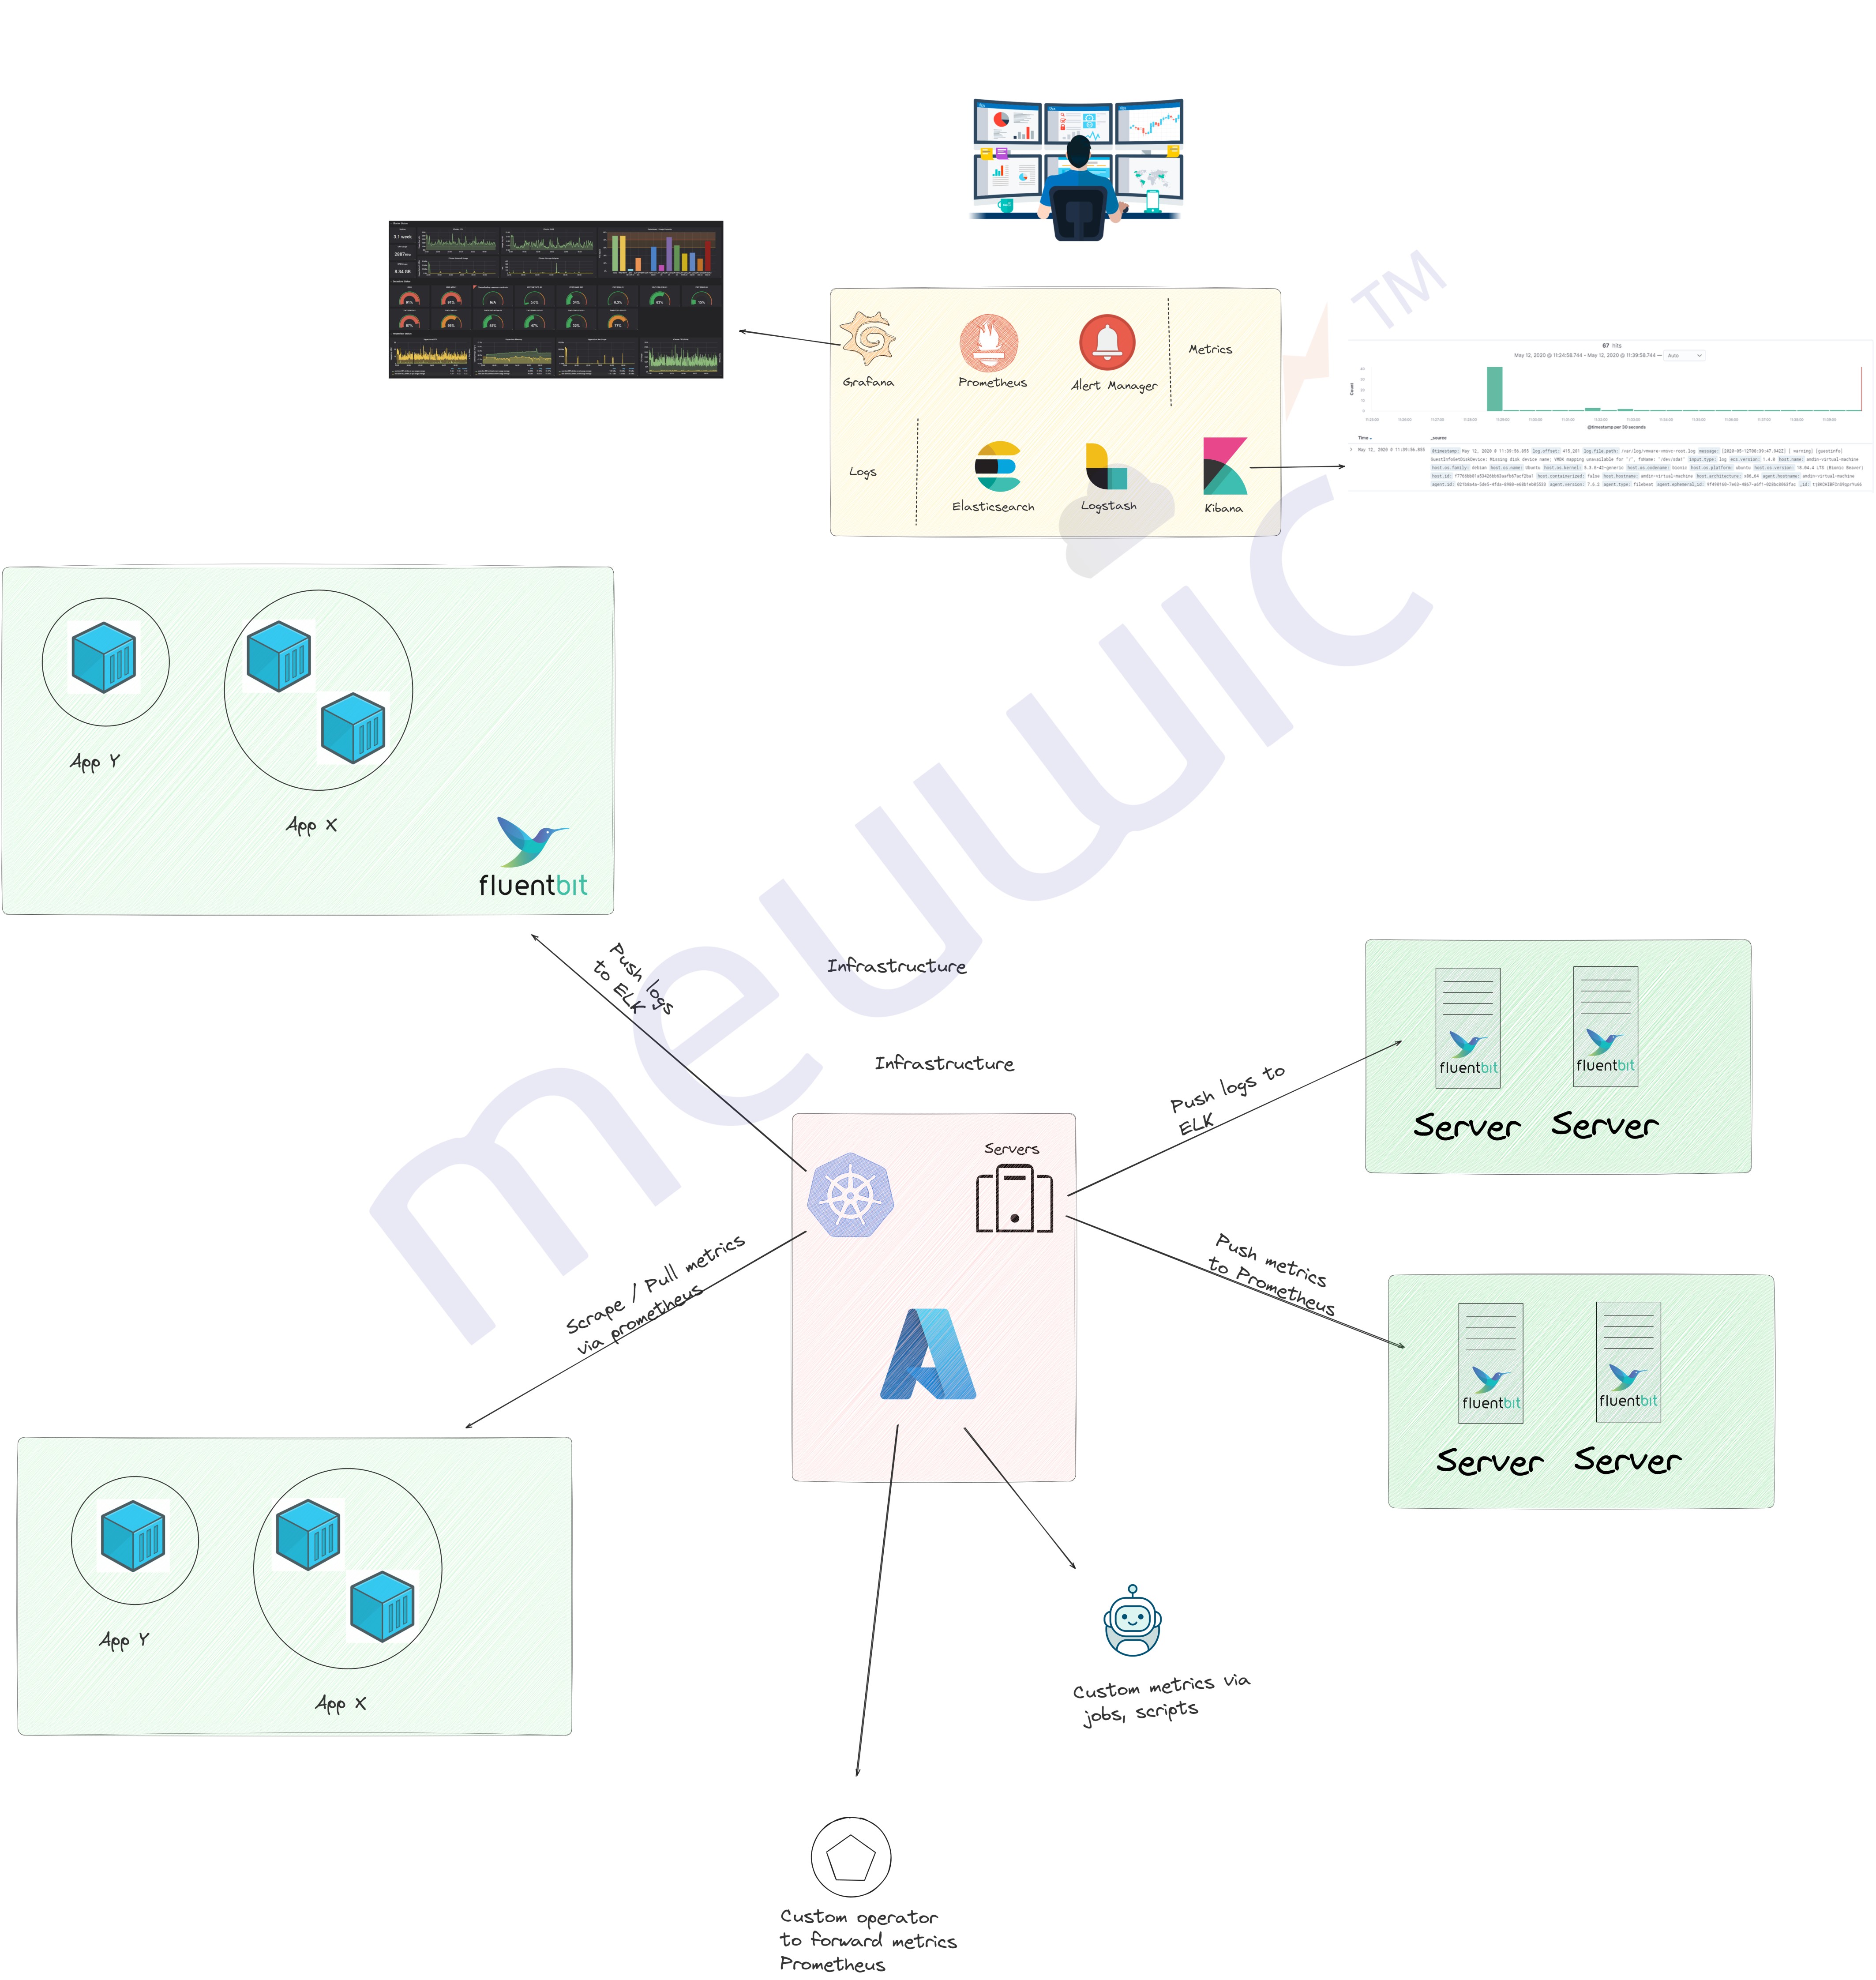
Monolithic:
We will also deploy agents like fluentbit / logstash and collect the logs based on the rules specified and export it to centralized logging solution
We will define the rules on what needs to be pushed and what not.
Functions:
Azure Monitor / AWS Cloudwatch, etc can be used to capture the logs/metrics and we can export them, view and create alerts via tools like Grafana / Elasticsearch.
>> Security Monitoring
We can also configure Security level Monitoring/Alerting for aggregating and analyzing telemetry in real time for threat detection and compliance. Try to collect event data from various sources like endpoints, network devices, cloud workloads, and applications for broader security coverage.. This includes:
Log Analysis
Vulnerability & Threat Detection
Centralized Security Control
Compliance Management
----
> Tools Comparison
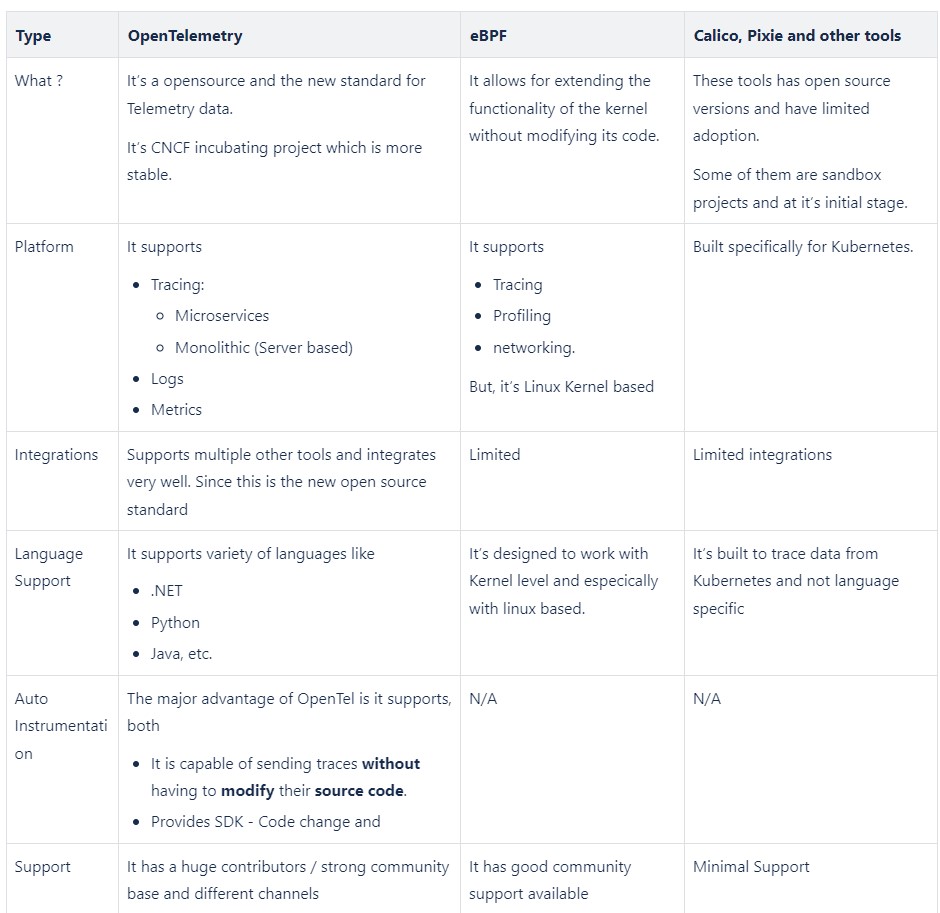
1. Tools Comparison (Importance to Tracing)
Compared to the tools and usecase, we can opt for other available tools as well. But OpenTelemetry is the preferred choice, especially for tracing due to its open-source nature and robust community support.
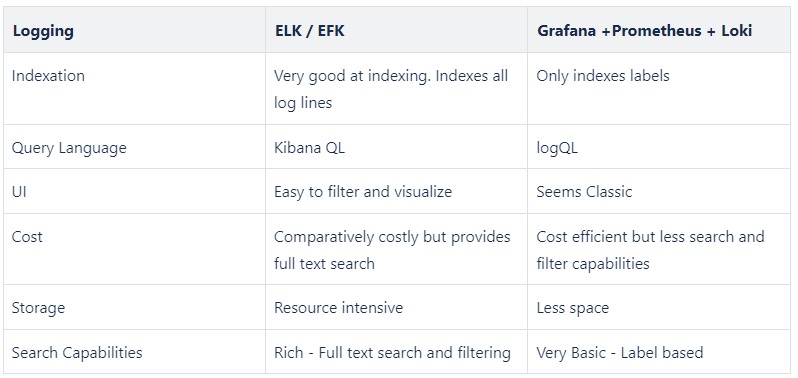
2. Tools Comparison for Logging
-- Choice is yours:
3. Tools for Metrics
There are many tools and vendors available in market. If you want a tool with most of the capabilities and still opensource, I would recommend to go with Grafana + Prometheus which is mature and flexible.
> Dashboard / Alerting / KPIs
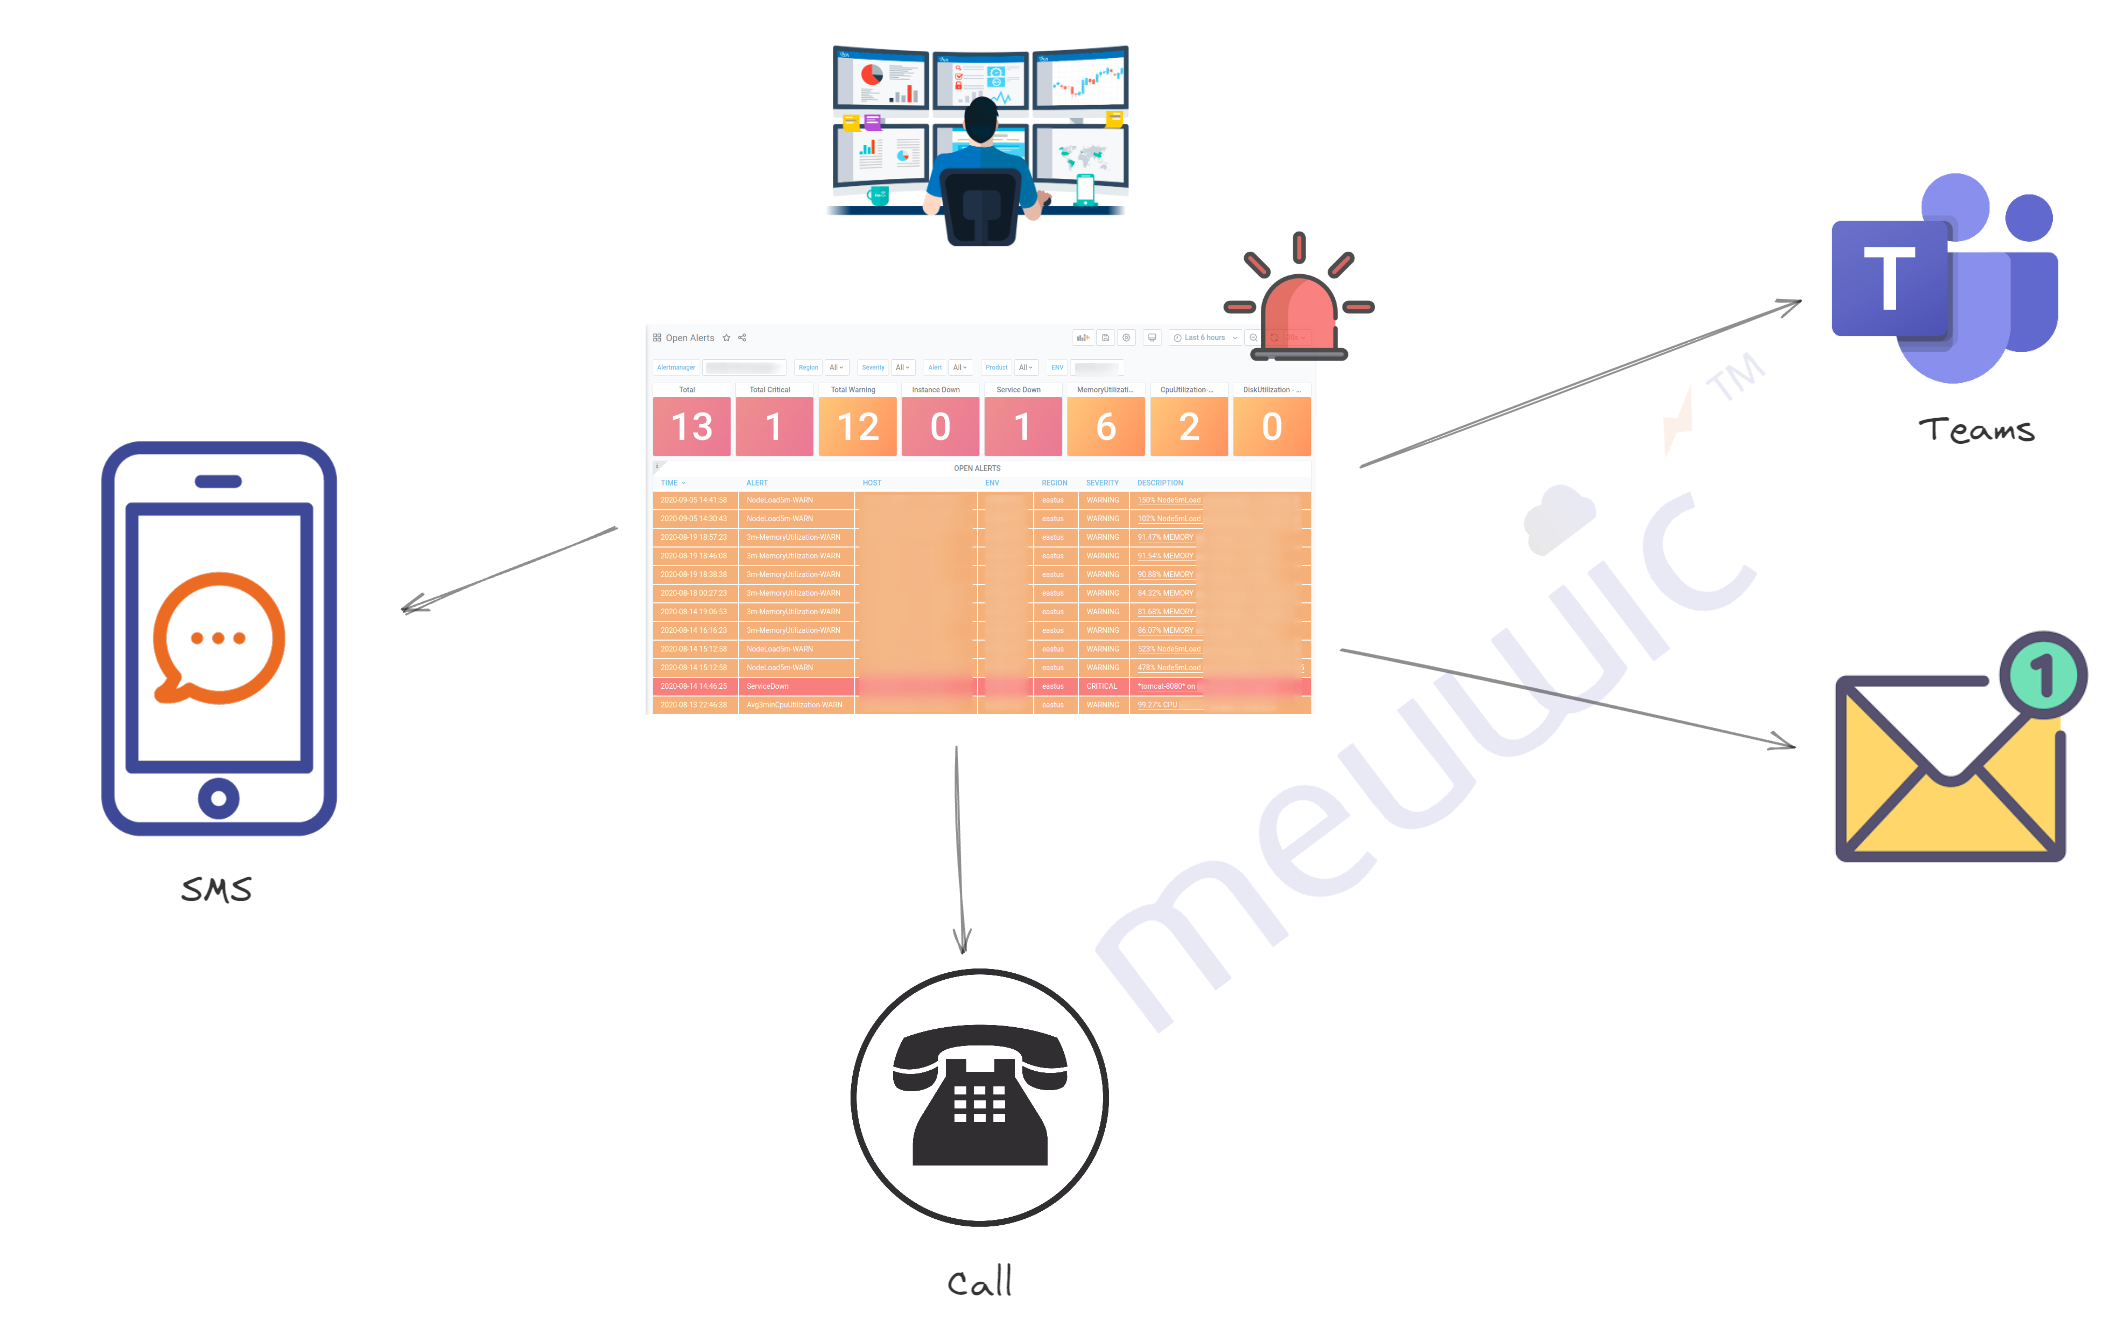
> Alerts
We have to come up with the KPIs and Alerts based on the requirement.
Infrastructure: We provide the standard KPIs for the infra level and create alerts based on that
Application: We have to get the KPIs from the application team in order to create efficient alerting mechanism.
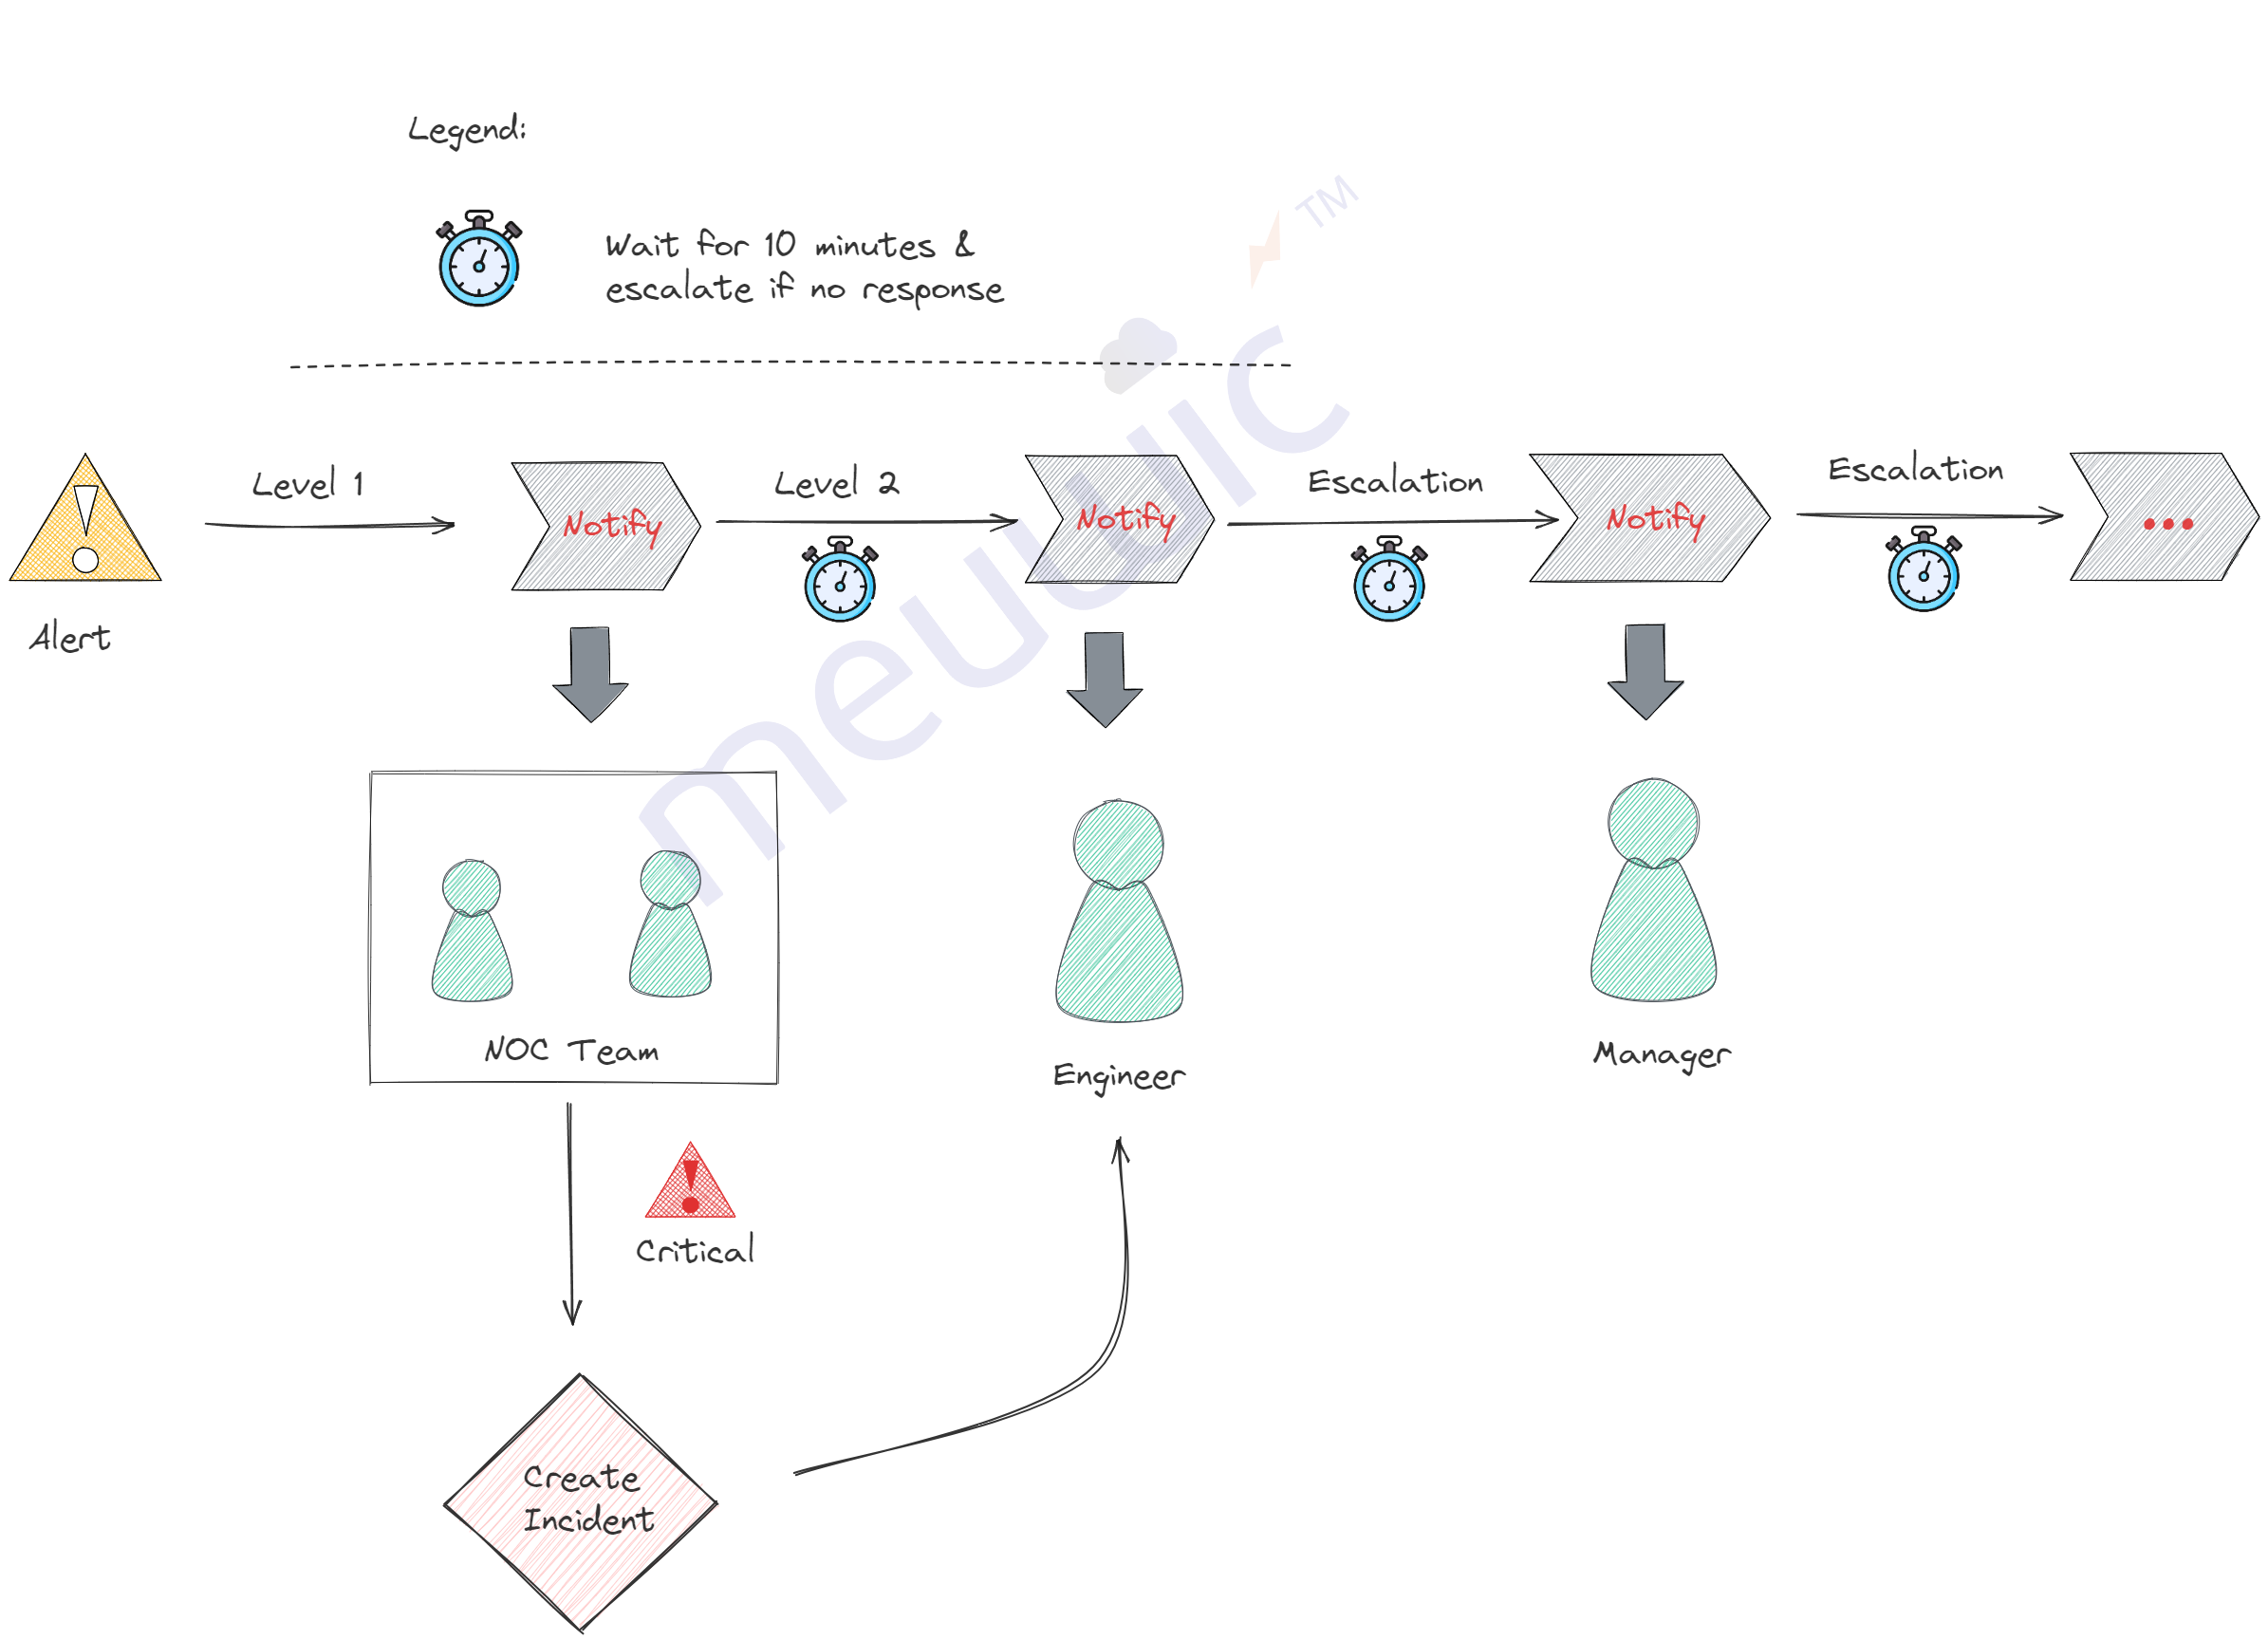
Notification: The alerts can be sent via Slack/Teams , Email, Phone call (Critical alerts) - Cost factor to be considered
Escalation Matrix: We have to frame the escalation matrix like Level 1, 2, Management, etc
Severity: Also the severity like Low, Warning, High, Severe
> Dashboards
The Log dashboards will be created along with inputs from the application team
Say, for logging,
a) What are all the labels to be filtered. b) What files to be monitored c) What errors to be monitored, etc.
For Metrics,
What are the important KPIs we are looking at.
a) Latencyb) Error Ratec) Resource Capacityd) Traffic